#syslog anomaly detection
Explore tagged Tumblr posts
Visit Tumblr Blog
Explore Tumblr blogs with no restrictions, modern design and the best experience.
Last Seen Tumblr Blogs


Fun Fact
In Q3 of 2020, 31% of US users access the Tumblr app daily.
Text
Atgeir specializes in Data Cloud solutions. Our teams of Data Architects and Engineers, boasting over 100 years of collective experience, leverage their extensive technical knowledge to empower clients within the Data Cloud ecosystem. We are committed to harnessing the synergies of Technology, Processes, and People to achieve tangible business results.
#technology staffing#Cost Management Suite India#log file anomaly detection#syslog anomaly detection#data governance consulting companies
0 notes
Text
Server Security: Analyze and Harden Your Defenses in today’s increasingly digital world, securing your server is paramount. Whether you’re a beginner in ethical hacking or a tech enthusiast eager to strengthen your skills, understanding how to analyze adn harden server security configurations is essential to protect your infrastructure from cyber threats. This comprehensive guide walks you through the key processes of evaluating your server’s setup and implementing measures that enhance it's resilience. Materials and Tools Needed Material/ToolDescriptionPurposeServer Access (SSH/Console)Secure shell or direct console access to the serverTo review configurations and apply changesSecurity Audit ToolsTools like Lynis, OpenVAS, or NessusTo scan and identify vulnerabilitiesConfiguration Management ToolsTools such as Ansible, Puppet, or ChefFor automating security hardening tasksFirewall Management InterfaceAccess to configure firewalls like iptables, ufw, or cloud firewallTo manage network-level security policiesLog Monitoring UtilitySoftware like Logwatch, Splunk, or GraylogTo track suspicious events and audit security Step-by-Step Guide to Analyzing and Hardening Server Security 1. Assess Current Server Security Posture Log in securely: Use SSH with key-based authentication or direct console access to avoid exposing passwords. Run a security audit tool: Use lynis or OpenVAS to scan your server for weaknesses in installed software, configurations, and open ports. Review system policies: Check password policies, user privileges, and group memberships to ensure they follow the principle of least privilege. Analyze running services: Identify and disable unnecessary services that increase the attack surface. 2. Harden Network Security Configure firewalls: Set up strict firewall rules using iptables, ufw, or your cloud provider’s firewall to restrict inbound and outbound traffic. Limit open ports: Only allow essential ports (e.g., 22 for SSH, 80/443 for web traffic). Implement VPN access: For critical server administration, enforce VPN tunnels to add an extra layer of security. 3. Secure Authentication Mechanisms Switch to key-based SSH authentication: Disable password login to prevent brute-force attacks. Enable multi-factor authentication (MFA): Wherever possible, introduce MFA for all administrative access. Use strong passwords and rotate them: If passwords must be used,enforce complexity and periodic changes. 4. Update and Patch Software Regularly Enable automatic updates: Configure your server to automatically receive security patches for the OS and installed applications. Verify patch status: Periodically check versions of critical software to ensure they are up to date. 5. Configure System Integrity and Logging Install intrusion detection systems (IDS): Use tools like Tripwire or AIDE to monitor changes in system files. Set up centralized logging and monitoring: Collect logs with tools like syslog, Graylog, or Splunk to detect anomalies quickly. Review logs regularly: Look for repeated login failures, unexpected system changes, or new user accounts. 6. Apply Security Best Practices Disable root login: prevent direct root access via SSH; rather,use sudo for privilege escalation. Restrict user commands: Limit shell access and commands using tools like sudoers or restricted shells. Encrypt sensitive data: Use encryption for data at rest (e.g., disk encryption) and in transit (e.g., TLS/SSL). Backup configurations and data: Maintain regular, secure backups to facilitate recovery from attacks or failures. Additional Tips and Warnings Tip: Test changes on a staging environment before applying them to production to avoid service disruptions. Warning: Avoid disabling security components unless you fully understand the consequences. Tip: Document all configuration changes and security policies for auditing and compliance purposes.
Warning: Never expose unnecessary services to the internet; always verify exposure with port scanning tools. Summary Table: Key Server Security Checks Security AspectCheck or ActionFrequencyNetwork PortsScan open ports and block unauthorized onesWeeklySoftware UpdatesApply patches and updatesDaily or WeeklyAuthenticationVerify SSH keys,passwords,MFAMonthlyLogsReview logs for suspicious activityDailyFirewall RulesAudit and update firewall configurationsMonthly By following this structured guide,you can confidently analyze and harden your server security configurations. Remember, security is a continuous process — regular audits, timely updates, and proactive monitoring will help safeguard your server against evolving threats. Ethical hacking principles emphasize protecting systems responsibly, and mastering server security is a crucial step in this journey.
0 notes
Text
Security Information and Event Management Market Growth | Global Expansion and Forecast to 2030
According to a recent report published by Allied Market Research, titled, “Security Information and Event Managements Market by Component, Deployment Model, Enterprise Size, and Industry Vertical: Global Opportunity Analysis and Industry Forecast, 2021–2030,” the global security information and event management market size was valued at $3.92 billion in 2020, and is projected to reach $18.12 billion by 2030, growing at a CAGR of 16.4% from 2021 to 2030.
The security information and event management (SIEM) market is expected to be driven by growing demand for security solutions that assist organizations in identifying possible security threats and vulnerabilities. As remote workforces, bring your own device (BYOD) and SaaS apps policies have increased in popularity, industries require the level of transparency to manage network potential risks from outside the traditional network perimeter. The advanced SIEM to be used for anomaly detection is expected to offer significant growth for the security information and event management industry in the near future. IBM Corporation’s QRadar Security Intelligence is the only known product, which qualifies for anomaly detection or behavioral analytics. The challenges in usage on SIEM in anomaly detection such as information of time to apply this analysis or efficient procedure to adjust time intervals to accommodate random and infrequent acts of humans, affect the extensive adoption of such SIEM products. However, with innovation and more refined understanding, the demand for such solutions is expected to increase during the forecast period.
Download Sample Report: https://www.alliedmarketresearch.com/request-sample/2313
On the basis of component, the solution segment dominated the overall security information and event management industry in 2020, and is expected to continue this trend throughout the security information and event management market forecast period. The rise in demand for modern SIEM tools to manage IT security is expected to drive the growth of the SIEM solution segment. The next generation SIEM is gaining momentum in the market due to its advanced features which help to tackle various challenges such as large number of events that are needed to be considered outside the syslog files which assist to move on an investigation forward; complexity of SIEM solutions; necessity of an expert personnel to handle the SIEM system; and others. Next gen platforms offer baselining capabilities, automation, and intelligence, which ensure data relevancy and noise filtration. In addition, technologies such as time normalization, metadata analysis, and file integrity monitoring deliver far advanced insights which is expected to drive the growth this segment. However, the services segment is expected to grow the most, and this trend is expected to continue during the forecast period. The growth in need for better security management, supportive government policies and rules to implement SIEM software, increase in adoption of SIEM on BYOD, and advancements in the SIEM technology has urged users to seek better knowledge and guidance to effectively implement the SIEM technology in enterprises to gain maximum output with high quality. These services make it easier to implement and use SIEM solution at the maximum efficiency and capabilities, which is expected to drive the growth of the service segment.
On the basis of industry vertical, the BFSI sector garnered the largest security information and event management market share in 2020, and is expected to continue this trend during the forecast period. Banks and financial institutions operate in a high-threat environment where efficient IT threat management is critical capability along with compliance. SIEM offers threat detection, risk monitoring, and necessary analytics to manage external and internal attacks. SIEM offers continuous risk monitoring, account monitoring, defense against external threats, risk mitigation, and risk routing. However, the healthcare sector is expected to witness highest growth in the upcoming years.
The global security information and event management market size was valued at $3.92 billion in 2020, and is projected to reach $18.12 billion by 2030, growing at a CAGR of 16.4% from 2021 to 2030. The COVID-19 outbreak has a positive impact on the growth of the security information and event managements market due to security and safety reasons. However, the outbreak of COVID-19 has affected communities globally, while governments and other sectors are trying their best to respond faster to the challenges posed by this pandemic. Furthermore, governments and businesses are increasingly asking employees to work from home or are shifting work to employees in less affected areas to maintain business continuity during the pandemic. However, the situation has accelerated the adoption of advanced technologies such as artificial intelligence (AI), machine learning (ML), automation, and IOT to control costs while improving the customer experience, which is expected to provide lucrative opportunities for security information and event managements market. Further, industries such as public sector, banking & financial sector, government sector, and healthcare sector have shown increased adoption of security information and event managements and are expected to continue using them owing to the rising focus on digitization, growing technological awareness, and need for better security systems. Increasing government initiatives to deploy advanced security solutions for better safety and convenience is anticipated to create significant growth opportunities for major players.
Inquiry Before Buying: https://www.alliedmarketresearch.com/purchase-enquiry/2313
Key Findings Of The Study
On the basis of component, the solution segment dominated the security information and event managements market in 2020. However, the services segment is expected to exhibit significant growth during the forecast period.
On the basis of enterprise size, the large enterprise segment dominated the security information and event managements market in 2020. However, the SMEs segment is expected to exhibit significant growth during the forecast period.
On the basis of deployment model, the on-premise segment dominated the security information and event managements market in 2020. However, the cloud segment is expected to exhibit significant growth during the forecast period.
On the basis of industry vertical, the BFSI sector accounted for the highest revenue of market in 2020; however, the healthcare sector is expected to witness the highest growth rate during the forecast period.
On the basis of region, the security information and event managements market was dominated by North America in 2020. However, Asia-Pacific is expected to witness significant growth in the coming years.
This report gives an in-depth profile of some key market players in the security information and event managements market, which includes Dell EMC, Hewlett Packard Enterprise Development LP, IBM Corporation, LogRhythm, Inc., McAfee LLC., SolarWinds, Inc., Splunk, Inc., Symantec Corporation, Trend Micro, Inc., and Trustwave Holdings Inc. This study includes market trends, security information and event management market analysis, and future estimations to determine the imminent investment pockets.
About Us: Allied Market Research (AMR) is a full-service market research and business-consulting wing of Allied Analytics LLP based in Portland, Oregon. Allied Market Research provides global enterprises as well as medium and small businesses with unmatched quality of “Market Research Reports Insights” and “Business Intelligence Solutions.” AMR has a targeted view to provide business insights and consulting to assist its clients to make strategic business decisions and achieve sustainable growth in their respective market domain.
#Security Information and Event Management Market#Security Information and Event Management Industry#Security Information and Event Management
0 notes
Text
Network diagnostics and tools in CCNA
CCNA Course, Network diagnostics and tools are integral components of the Cisco Certified Network Associate (CCNA) curriculum, enabling network professionals to efficiently identify, analyze, and resolve issues affecting network connectivity, performance, and security.
Ping and Traceroute: CCNA candidates learn to use the ping and traceroute commands to diagnose connectivity problems. Ping tests reachability by sending ICMP (Internet Control Message Protocol) echo requests, while traceroute traces the route that packets take through the network, helping pinpoint where connectivity breaks down.
Cable Testers: Cable testers are crucial tools for assessing the integrity of network cables. CCNA students learn how to use cable testers to identify cable faults such as open circuits, shorts, and mismatches. These tools ensure reliable physical connectivity.
Protocol Analyzers (Wireshark): Wireshark is a widely-used protocol analyzer that captures and analyzes network traffic in real time. CCNA coursework includes using Wireshark to inspect packet headers and contents, diagnose network issues, and identify abnormal traffic patterns.
Netstat and Nmap: Netstat displays network statistics and active connections on a device. CCNA candidates learn to use this tool to identify open ports, active connections, and network utilization. Nmap is a port scanning tool used to discover devices on a network and assess their open ports and services.
Syslog and SNMP Monitoring: CCNA training covers using Syslog servers to collect and analyze log messages from network devices. This helps identify anomalies, security breaches, and performance issues. Simple Network Management Protocol (SNMP) is employed to monitor network device status and performance, enabling proactive issue detection.
Packet Captures and Analyzers: CCNA students gain experience with packet captures using tools like Wireshark. Capturing and analyzing network packets aids in diagnosing issues related to protocol errors, network congestion, and security breaches.
Hands-on Practice: Practical labs and simulations within the CCNA curriculum allow candidates to apply diagnostic tools to real-world scenarios. By troubleshooting simulated network issues, candidates develop practical expertise in using these tools effectively.
Proficiency in network diagnostics and tools empowers network professionals to maintain optimal network health, promptly address
0 notes
Text
Log Analysis using AI/ML for Broadband

Log Analysis using Artificial Intelligence/Machine Learning [AI/ML] for Broadband
Whenever you hear about “Log analysis”, we picture a developer, going through 1000s of lines of logs to figure out a problem. Does it always have to be like this? Our topic of discussion is what can Artificial Intelligence/Machine Learning [AI/ML]do to help us in Log analysis.
Need for Automated Log Analysis
In large-scale systems, the seemingly obvious way of log analysis is not so scalable. A broadband network managed by an operator like Comcast, having 100s of Wi-Fi Access Points and Routers/Switches and 4G/5G small cells, from multiple equipment providers, say Commscope, Aruba, or CISCO. Collection of logs at multiple nodes, there are GBs of data created every minute.
The possible issues are hidden, they may not be something as obvious as a crash. It may be a problem that occurred and went away and could not be detected, other than the fact that there were several complaints received by the Network Operators. These systems are developed by multiple developers (100(0)s), so it is difficult to be analyzed them by a single person. They pull out modules from various third parties and make extensive use of the open source. And then the parts of the systems are on continuous upgrade cycles. So there is a clearly established need for automated log analysis in large-scale networks through the use of smart log analysis techniques.
Mapping Log Analysis problem to Artificial Intelligence/Machine Learning [AI/ML] problem
Machine learning sees the problems in two ways:
supervised
unsupervised.
Supervised learning is applicable if we have a labeled data set i.e. input data, where we know the label (or value). With this data, we can train the model. After Training, the model can take the new input and predict the label (or value).
Unsupervised learning means we do not have labeled data sets. The model classifies data into different classes. When the new data arrives, it finds the correlation with the existing classes and puts it into one of those classes.
For log analysis, we are basically looking for anomalies in the log, something that is not normally expected. We may or may not have labeled data sets, and accordingly, we need to pick supervised or unsupervised learning.
Anomaly Detection algorithms. For supervised algorithms, we will have data sets, where each set is labeled as “normal” or “Anomaly”. For unsupervised algorithms, we need to configure the model for two classes only, “Normal” or “Anomaly”.
A combined approach is good for the broadband use case, where both can be used. For clear anomalous behaviour we can use supervised methods. And when creating an exhaustive labeled data set may not be possible, we can fall back to unsupervised.
These algorithms exist already and there are open-source implementations as well. (refer References)
Mapping Logs to Artificial Intelligence/Machine Learning [AI/ML] input
There are many ongoing online logs coming from various nodes. The only way to make a data set is to time-slice them, into smaller log snippets. Using each snippet we have to convert it into a data set.
Now the logs are distributed, coming from switches, routers, SysLogs and Pcaps, and Others. Do we need different models for each kind of log? No. The logs have to be given to a single Model as only then the correlation between different logs can be harnessed.
The logs are unstructured text, can we use (Natural Language Processing) Models to extract data sets from the logs. The answer is again “No”. For NLP models, the text is preprocessed to get features like the number of times a word is repeated, the different words followed by each other, and other features. There are pre-trained models which can do this and have been trained over the entire Wikipedia text! But these can not be used for logs, as logs have technical context and not the natural language.
Since logs have an underlying structure, we can view the log snippets as a series of predefined events. This way we can retain the information in each log. It also helps aggregate different kinds of logs, as we can consider the logs having different sets of events. The model will be trained by understanding based on events that are happening in a given time window and can then detect anomalies.
Constructing Artificial Intelligence/Machine Learning [AI/ML] Training data set from Logs
Artificial Intelligence/Machine Learning [AI/ML] works on vectors/matrices of numbers and additions and multiplications of these numbers. We can not feed these events directly to the model. They need to be converted into numbers. (Gradient Descent and Logistic Regression works with finding derivatives. Deep learning is Matrix multiplications and lots of it. Decision Trees or Random forests partition the data on numbers.)
For computer vision and image processing use cases, these numbers are the RGB value of each pixel in the image. For tabular data, the text is converted into numbers by assigning ordered or unordered series.
One option is to associate each event with an identifier number and give vectors of these identifiers to the model, along with a timestamp. However, synchronizing/aggregating this will be an issue as we will start getting these vectors from each node. Also one event may happen multiple times, in the snippet, so handling of these vectors will become complex.
So a better method is to collate vectors from each node for a given time slice and then go with the count of each kind of event in a master vector.
We explain the approach below in detail. The approach is derived from this popular paper, for more details please refer https://jiemingzhu.github.io/pub/slhe_issre2016.pdf)
1.Log Collection –
In broadband systems, we have multiple sources of logs (SysLog, Air captures, wired captures, Cloud Logs, Network element i.e. switches/Routers/Access Points logs). We need to first be able to gather logs from each of the sources.
We need to make an exhaustive list of all sources as
[S1, S2, S3.. Sn]
2.Event Definition – For each source, we need to come up with predefined event types. In the networking world, broadly event types in the logs, can be defined as follows
Protocol message
Errors/Alerts
Each Type is one event type
Layer
Management
Each Type is one event type
Control
Each Type is one event type
Data
Each Type is one Event type
State Change
Error Alerts
Each Type is one event type
Module
Each Critical Log Template is an event type
Each State Transitions is an event type
Errors/Alerts
Each type of Error/Alert is one event type each Leaf node corresponds to a different event
With this analysis, for each source, we come up with a list of events, as follows
[S1E1, S1E2, S1E3,.. S1Em,
S2E1, S2E2, S2E3,.. S2En,
… ,
SnE1, SnE2, SnE3,.. SnEp]
3.Log to Event conversion – Each line of the time series log will have a constant part and a variable part. The constant part is what we are interested in. Variable parts like IP addresses, source and destination are variable and need to be ignored. We need to parse logs for the constant parts, to check if the log has any event or not, and record only the event. Then the log snippet taken over a window of time will start looking like something like this for a source.
[T1, E2
T2, Nil
T3, E2
T4, E4]
4.Frequency transform – Invert the parsed log to find event frequency. Basically in a given time window how many times an event happened. So if the window goes from Time 1 to Time 4.

Going for multiple time slices it will look like this

The window can be fixed with timer intervals. These can be non-overlapping or sliding. Sliding windows can give better results, but maybe more computationally intensive.
For balancing computation load, it is advisable to do edge compute i.e. derive the Event Count Matrix separately from each source.
5.Event Frequency Matrix – Once the event count matrix is being fetched from each source, they should be all combined at a central place, before being fed to the ML world.
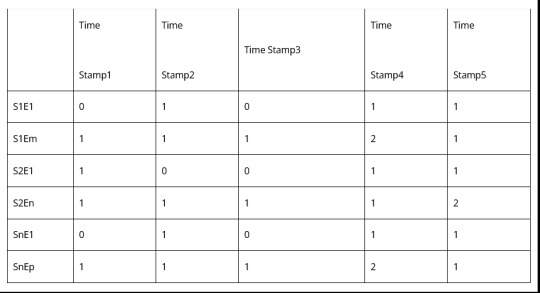
Highlighted Part is the final Matrix that is an input to the ML system. Each window is fed with a timestamp. So it becomes a time series input vector. Set of these vectors will make a data set. So finally now we have the data set for log analysis!
Resources
[1] AI/ML Theory Machine Learning by Stanford University
[2] Applied AI/ML Tutorial Deep Learning For Coders—36 hours of lessons for free
[3] Log Analysis AI/ML Research Paper Experience Report: System Log Analysis for Anomaly Detection
[4] LogPai/Loganaly (logpai/loglizer: A log analysis toolkit for automated anomaly detection [ISSRE’16])
[5] AICoE/LAD (AICoE/log-anomaly-detector: Log Anomaly Detection – Machine learning to detect abnormal events logs)
Request a Call
0 notes
Text
Best Cloud Monitoring Tools of 2020

When providing services to your customers you need to keep an eye on everything that could impact your success with that – from low-level performance metrics to high-level business key performance indicators. From server-side logs to stack traces giving you full visibility into business and software processes that underpin your product. That’s where cloud monitoring tools and services come into play. They help you achieve full readiness of your infrastructure, applications, and make sure that your users and customers can use your platform to its full potential.
What Is Cloud Monitoring?
Cloud monitoring is a process of gaining observability into your cloud-based infrastructure, services, applications, and user experience. It allows you to observe the environment, review, and predict performance and availability of the whole infrastructure or drill into each piece of it on its own. Cloud monitoring works by collecting observability data, such as metrics, logs, traces, etc. from your whole IT infrastructure, analyzing it, and presenting it in a format understood by humans, like charts, graphs, and alerts, as well as machines via APIs
Best Cloud Monitoring Tools
There are many types of tools that can help you gain full observability into your infrastructure, services, applications, website performance and health. Some help you with just one aspect of monitoring, while others give you the full visibility into all of the key performance indicators, metrics, logs, traces,etc. Some you can set up easily and without talking to sales, others are more complex and involve a more traditional trial and sales process. Each solution has its pros and cons – sometimes the flexibility of a solution comes with a higher setup complication, while the setup and ease of use comes with a limited set of features. As users we need to choose the solution that’s the best fit for our needs and budget. In this post, we are going to explore the cloud monitoring tools that you should be aware of and that will let you know if your business and its IT operations are healthy. 1. Sematext Cloud


Sematext Cloud and its on-premise version – Sematext Enterprise – is a full observability solution that is easy to set up and that gives you in-depth visibility into your IT infrastructure. Dashboards with key application and infrastructure (e.g., common databases and NoSQL stores, servers, containers, etc.) come out of the box and can be customized. There is powerful alerting with anomaly detection and scheduling. Sematext Cloud is the solution that gives you both reactive and predictive monitoring with easy analysis. Features Auto-discovery of services enables hands-off auto-monitoring. Full-blown log management solution with filtering, full-text search, alerting, scheduled reporting, AWS S3, IBM Cloud, and Minio archiving integrations, Elasticsearch-compatible API and Syslog support. Real user and synthetic monitoring for full visibility of how your users experience your frontend and how fast and healthy your APIs are. Comprehensive support for microservices and containerized environments – support for Kubernetes, Docker, and Docker Swarm with ability to observe applications running in them, too; collection of their metrics, logs, and events. Network, database, processes, and inventory monitoring. Alerting with anomaly detection and support for external notification services like PagerDuty, OpsGenie, VictorOps, WebHooks, etc. Powerful dashboarding capabilities for graphing virtually any data shipped to Sematext. Scheduled reporting. Pros: Lots of out of the box integrations. Lightweight, open-sourced and pluggable agents. Quick setup. Powerful Machine Learning-based alerting and notifications system to quickly inform you about issues and potential problems with your environment. Elasticsearch and InfluxDB APIs allow for the integration of any tools that work with those, like Logstash, Filebeat, Fluentd, Logagent, Vector, etc.. Easy correlation of performance metrics, logs, and various events. Collection of IT inventory – installed packages and their versions, detailed server info, container image inventory, etc. Straightforward pricing with free plans available, generous 30-days trial. Cons: Limited support for transaction tracing. Lack of full-featured profiler. Pricing: The pricing for each solution is straight forward. Each solution lets you choose a plan. As a matter of fact, pricing is super flexible for the cost-conscious — you have the flexibility of picking a different plan for each of your Apps. For Logs there is a per-GB volume discount as your log volume or data retention goes up. Performance monitoring is metered by the hour, which makes it suitable for dynamic environments that scale up and down. Real user monitoring allows downsampling that can minimize your cost without sacrificing the value. Synthetic monitoring has a cheap pay-as-you-go option. 2. AppDynamics

Available in both software as a service and an on-premise model AppDynamics is more focused on large enterprises providing the ability to connect application performance metrics with infrastructure data, alerting, and business-level metrics. A combination of these allows you to monitor the whole stack that runs your services and gives you insights into your environment – from top-level transactions that are understood by the business executives to the code-level information useful for DevOps and developers. Features: End-user monitoring with mobile and browser real user, synthetic, and internet of things monitoring. Infrastructure monitoring with network components, databases, and servers visibility providing information about status, utilization, and flow between each element. Business-focused dashboards and features provide visualizations and analysis of the connections between performance and business-oriented metrics. Machine Learning supported anomaly detection and root cause analysis features. Alerting with email templating and period digest capabilities. Pros: Very detailed information about the environment including versions, for example, JVM application startup parameters, JVM version, etc. Provides advanced features for various languages – for example, automatic leak detection and object instance tracking for the JVM based stack. Visibility into connections between the system components, environment elements, endpoint response times, and business transactions. Visibility into server and application metrics with up to code-level visibility and automated diagnostics. Cons: Pricing: very expensive, complex, and non-transparent. Focused on more traditional high-touch sales model and selling to large enterprises. Installation of the agent requires manual downloading and starting of the agent – no one-line installation and setup command. Some of the basic metrics like system CPU, memory, and network utilization are not available in the lowest, paid plan tier. Slicing and dicing through the data is not as easy compared to some of the other tools mentioned in this summary that support rich dashboarding capabilities like Sematext, Datadog, or New Relic. Pricing Agent and feature-based pricing is used which makes the pricing not transparent. The amount of money you will pay for the solution depends on the language your applications are written in and what functionalities you need and want to use from the platform. For example, visibility into the CPU, memory, and disk metrics requires the APM Advanced plan. 3. Datadog

Datadog is a full observability solution providing an extended set of features needed to monitor your infrastructure, applications, containers, network, logs, or even serverless features such as AWS lambdas. With the flexibility and functionality comes a price though – the configuration based agent installation may be time-consuming to set up (e.g. process monitoring requires agent config editing and agent restart) and quite some time may pass before you start seeing all the metrics, logs, and traces – all in one place for that full visibility into your application stack that you are after. Features: Application performance monitoring with a large number of integrations available and distributed tracing support. Logs centralization and analysis. Real user and synthetics monitoring. Network and host monitoring. Dashboard framework allows building of virtually everything out of the provided metrics and logs and sharing those. Alerting with machine learning capabilities. Collaboration tools for team-based discussions. API allowing to work with the data, tags, and dashboards. Pros: Full observability solution – metric, logs, security, real user, and synthetics all in one. Infrastructure monitoring including hosts, containers, processes, networks, and serverless capabilities. Rich logs integration including applications, containers, cloud providers, clients, and common log shippers. Powerful and very flexible data analysis features with alerts and custom dashboards. Provides API allowing interaction with the data. Cons: Overwhelming for newcomers with all the installation steps needed for anything beyond basic metrics. Not a lot of pre-built dashboards compared to others. New users have to invest quite a bit of time to understand metrics and build dashboards before being able to make full use of the solution. Pricing Feature, host, and volume-based pricing combined together – each part of the solution is priced differently that can be billed annually or on-demand. The on-demand billing makes the solution about 17 – 20% more expensive than the annual pricing at the time of this writing. Pay close attention to your bill. We’ve seen a number of reports where people were surprised by bill items or amounts. 4. New Relic

Source: New Relic New Relic as a full-stack observability solution is available in software-as-a-service model. Its monitoring capabilities include application performance monitoring with rich dashboarding support, distributed tracing support, logs along with real user and synthetics monitoring for the top to bottom visibility. Even though the agents require manual steps to download and install they are robust and reliable with a wide range of common programming languages support which is a big advantage of New Relic. Features: Application Performance Monitoring with dashboarding and support for commonly used languages including C++. Log centralization and analysis. Integrated alerting with anomaly detection. Rich and powerful query language – NRQL. Real user and synthetics monitoring. Distributed tracing allowing you to understand what is happening from top to bottom. Integration with most known cloud providers such as AWS, Azure, and Google Cloud Platform. Business level metrics support. Pros: Visibility into the whole system, not only when using physical servers or virtual machines, but also when dealing with containers and microservices. Ability to connect business-level metrics together with performance to correlate them together. Error analytics tool for quick and efficient issues analysis, like site errors or downtime. Rich visualization support allowing to graph metrics, logs, and NRQL queries. Ability to define the correlation between alerts and defined logic to reduce alert noise. Cons: The platform itself doesn’t provide agent management functionality, which leads to additional work related to installation and configuration, especially on a larger scale. Inconsistent UI: some parts of the product use the legacy interface, while others are already a part of NewRelic One. The log management part of the solution is still young. Lack of a single pricing page for all features. Pricing: Annual and monthly compute unit or host-based pricing and depends on the features (for example: APM pricing, infrastructure pricing, synthetic pricing). For small services, the computing units may be the best option as they are calculated as the total number of CPUs with the amount of RAM your system has, multiplied by the number of running hours. For example, the infrastructure part of New Relic uses only compute units pricing, while the APM can be charged on both host and compute units-based pricing. This may be confusing and requires additional calculations if you want to control your costs. 5. Dynatrace

Dynatrace is a full-stack observability solution that introduces a user-friendly approach to monitoring your applications, infrastructure, and logs. It supports a single running agent that, once installed, can be controlled via Dynatrace UI making monitoring easy and pleasant to work with. Available in both software as a service and on-premise models it will fulfill most of your monitoring needs when it comes to application performance monitoring, real users, logs and infrastructure. Features: Application performance monitoring with dashboarding and rich integrations for commonly used tools and code-level tracing. First-class Log analysis support with automatic detection of the common system and application log types. Real user and synthetic monitoring. Diagnostic tools allow taking memory dumps, exceptions and CPU analysis, top database, and web requests. Docker, Kubernetes, and OpenShift integrations. Support for common cloud providers like Amazon Web Services, Microsoft Azure, and Google Cloud Platform. A virtual assistant can make your life easier when dealing with common questions. Pros: Simple and intuitive agent installation with UI guidance for new users with demo data to get to know the product faster. Ease of integration to gain visibility into the logs of your systems and applications – almost everything is doable from the UI. Easy to navigate and powerful top to bottom view of the whole stack – from the mobile/web application through the middle tier up to the database level. Dedicated problem-solving functionalities to help in quick and efficient problem finding. Cons: Lots of options can be overwhelming to start with, but the solution tries to do its best to help new users. Business metrics analysis is still limited compared to AppDynamics and Datadog, for example. Serverless offering is limited when compared to other solutions on the market, like Datadog, New Relic, and AppDynamics. Pricing information is only available once you sign up. Pricing Pricing is organized around features. The application performance monitoring pricing is tied to hosts and the amount of memory available on a host. Each 16GB is a host unit and the price is calculated on the basis of the number of host units in an hour. The real user monitoring price is calculated based on the number of sessions, while the synthetics monitoring pricing is based on the number of actions. Finally, the logs part of the solution is calculated based on the volume, similar to other vendors covered in this article. 6. Sumo Logic

Source: Sumologic Sumo Logic is an observability solution with strong focus on working with logs and it does that very well. With tools like LogReduce and LogCompare you can not only view the logs from a given time period but also reduce the volume of data you need to analyze or even compare periods to find interesting discrepancies and anomalies. Combining that with metrics and security gives a great tool that will fulfill the observability needs for your environment. Features: Log analysis with the LogReduce algorithm allows clustering of similar messages and LogCompare lets you compare data from two time periods. Field extraction enables rule-based data extraction from unstructured data. Application performance monitoring with real-time alerting and dashboarding. Scheduled views for running your queries periodically. Cloud security features for common cloud providers and SaaS solutions with PCI compliance and integrated threat intelligence. Pros: User-friendly interface that doesn’t overwhelm novice users and is still usable for experienced ones. Ability to reduce the number of similar logs at read-time and compare periods of time together which can help to spot differences, anomalies, and track down problems quickly. Possibility to extract fields from unstructured data allows you to drop the processing component from your local pipeline and move it to the vendor side. Limited free tier available that may be enough for very small companies. Cons: Pricing may be confusing and may be hard to pre-calculate when using Cloud Flex credits and larger environments. A limited number of out of the box charts compared to the competition. Primarily focused on logs puts them at a disadvantage if you are looking for a full-stack observility solution. Pricing Credit and feature-based pricing with a limited free tier is available. A credit is a unit of utilization for ingested data – logs and metrics. The needed features dictate the price of each credit unit – the more features of the platform you need and will use, the more expensive the credit will be. Please keep in mind that the price also depends on the location you want to use. For example, at the time of this writing, the Ireland location was more expensive compared to North America. 7. CA Unified Infrastructure Monitoring (UIM)

Source: Broadcom Available in both the SaaS and on-premise models, targeted at the enterprise customers the DX Infrastructure Manager, formerly called CA Unified Infrastructure Monitoring is a unified tool that allows you to get observability into your hybrid cloud, services, applications, and infrastructural elements like switches, routers and storage devices. With the actionable log analytics, out of the box dashboard, and alerting with anomaly detection algorithms the solution will give you retrospective and proactive views over your IT environment. Features: Monitoring with various integrations supporting common infrastructure provides and services including packaged applications such as Office 365 and tools like Salesforce Service Cloud. Log analytics with actionable, out of the box dashboards and rich visualization support. Alerting with anomaly detection and dynamic thresholds. Reporting with business-level metrics support and scheduling capabilities. Pros: Easy deployment and configuration with configurable automatic service discovery. Templates support which allows you to build templates per environment, devices, and more. Advanced correlations for hybrid infrastructures. In-depth monitoring of the whole infrastructure with the help of various integrations. Cons: Non-transparent pricing — the pricing is not available on the web site. A limited number of alert notification destinations compared to other competitors. May be considered complicated for novice users. Targeted for enterprise customers. Dated UI. Pricing At the time of this writing the pricing was not publicly available on the vendor’s site. 8. Site 24×7

Source: Site24x7 Site 24×7 is an observability solution providing all that is needed to get full visibility into your website’s health, application performance, infrastructure, and network gear. Both when it comes to metrics and logs. Set up alerts based on advanced rules to limit down the alerts fatigue and get insights from your mobile applications. Monitor servers and over 50 common technologies running inside your environment including common and widely used Apache or MySQL. Features: Website monitoring with the support for monitoring HTTP services, DNS and FTP servers, SMTP and POP servers, URLs, and REST APIs available both publicly and in private networks. Server monitoring with support for Microsoft Windows and Linux and over 50 common technologies plugins, like MySQL or Apache. Full features network monitoring with routers, switches, firewalls, load balancers, UPS, and storage support. Application performance monitoring and log management with support for server, desktop, and mobile applications and alerting capabilities. Cloud monitoring with support for hybrid cloud infrastructure. Pros: Quick and easy agent installation. Monitoring for various technologies with alerting support based on complex rules. Full observability with visibility from your website performance and health up to network-level devices like switches and routers. Custom dashboarding support lets you build your own views into the servers, applications, websites, servers, and cloud environments. Pluggable server monitoring allows you to write your own plugins where needed. Free, limited uptime and server monitoring which might be enough for personal needs or small companies. Cons: The number of features can be overwhelming for novice users. It can be time-consuming when setting up in a larger environment because of the lack of autodiscovery. A limited number of technologies when it comes to server monitoring. Pricing The pricing depends on the parts of the product that you will use with the free uptime monitoring for a small number of websites and servers available. The infrastructure monitoring starts with the 9 euro per month when billed annually for up to 10 servers, 500MB of logs, and 100K page views for a single site. You can buy additional add-ons for a monthly fee. You can also go for pure website monitoring or application performance monitoring or so-called “All-in-one” plan, which covers all the features of the platform. 9. Zabbix

Source: Zabbix Open-sourced monitoring tool capable of real-time monitoring large scale enterprises and small companies. If you are looking for a solution with a large community, well supported, and free you should look at Zabbix. Its multi-system, small footprint agents allow you to gather key performance indicators across your environment and use them as a source for your dashboards and alerts. With the template-based setup and auto-discovery you can speed up even the largest setups. Features: Multi-system, small footprint agent allowing to gather crucial metrics with support for SNMP and IPMI. Problem detection and prediction mechanism with flexible thresholds and severity levels defining their importance. Multi-lingual, multi-tenant, flexible UI with dashboarding capabilities and geolocation support for large organizations with data centers spread around the world. Support for adjustable notifications with out of the box support for email, SMS, Slack, Hipchat and XMPP and escalation workflow. Template-based host management and auto-discovery for monitoring large environments. Pros: Well known, open-sourced, and free with a large community and commercial support. Wide functionality allowing to monitor virtually everything. It can be easily integrated with other visualization tools like Grafana. Easily extensible for support for technologies and infrastructure elements not covered out of the box. Cons: As an open-sourced and completely free solution, you need to host it yourself and maintain it, meaning paying for the team that will install and manage it. Initial setup can be tedious and not so obvious and requires knowledge, not only about the platform but also about the applications, servers, and infrastructure elements that you plan on monitoring making the initial step quite steep. Lack of dedicated functionality to monitor user experience, synthetic monitoring and no transaction tracing support. If you are looking for a software-as-a-service solution, Zabbix Cloud is coming, but as of this writing it is still in beta. Pricing Zabbix is open-sourced and free. You can subscribe for support, consultancy, and training around it though if you would like to quickly and efficiently extend your knowledge about the platform. 10. Stackify Retrace

Source: Stackify Stackify Retrace is a developer-centric solution providing users full visibility into their applications and infrastructure elements. With the availability of application performance monitoring, centralized logging, error reporting, and transaction tracing it is easy for a developer to connect pieces of information together when troubleshooting. All of that with help from the platform which connects those pieces together gluing the automated transaction tracing with the relevant logs and error data and proving the integrated profiler to give the top to bottom insight into the business transaction. Features: Centralized logging combined with error reporting. Transaction tracing and code profiling with automatic instrumentalization for databases like MySQL, PostgreSQL, Oracle, SQL Server, and common NoSQL solutions like MongoDB and Elasticsearch. Key performance metrics monitoring for your applications with alerting and notifications support. Server monitoring gives you insight into the most useful metrics like uptime, CPU & memory utilization, disk space usage, and more. Pros: Top to bottom view starting with the web requests and ending at the relevant log message connected together with the transaction trace. Integrated profiler with out of the box instrumentalization for common system elements like database or NoSQL store. In-line log and error data inclusion in tracing information makes it super easy to connect information together for fast troubleshooting. Support for custom dashboards and reports. Cons: No native support for Google Cloud at the time of writing. Real user monitoring “coming soon” at the time of writing. UI reminiscent of Windows. Pricing The pricing is based on data volume and is provided in three tiers – Essentials, Standard, and Enterprise. The Essentials package starts at $79/month allowing for 7 days of logs and traces retention, with up to 500k traces and 2m logs and up to 8 days of summary data retention with all the standard features provided. The Standard plan starts from $199 with additional features available for an appropriate higher price.. 11. Zenoss

Source: Zenoss Multi-vendor infrastructure monitoring with support for end-to-end troubleshooting and real-time dependency mapping. With support for server monitoring including coming metrics, health and excellent network monitoring the Zenoss platform gives you visibility into your infrastructure, no matter if it is a private, hybrid, or a public cloud. Features: Infrastructure monitoring with the support for public, private, and hybrid clouds and real-time dependency mapping. Server monitoring with support for common metrics, health, physical sensors like temperature sensors, file systems, processes, network interfaces, and routes monitoring. Application performance monitoring available via ZenPacks with support for incident root cause analysis and metrics importance voting along with containers and microservices support. Support for logs with the support of log format unification. Pros: Multi-vendor support for a wide variety of hardware and software infrastructure elements. Automatic discovery for dynamic environments like containers and microservices. Extensibility via ZenPacks – available both as driven by the community and commercial extensions with SDK allowing you to develop new extensions easier. The self-managed, limited community version of the platform available as a solution with basic functionality and minimum scale. Cons: Application performance monitoring available via ZenPacks extension or integration with third-party services. Available only in the on-premise model with no free trial available which makes it hard to test the platform. No features like real user monitoring, synthetic monitoring or transaction tracing. Focused on medium and large customers. Pricing At the time of writing the pricing was not publicly available on the vendor’s site, but one thing worth noting is the availability of the community version of the solution allowing you to install a limited, self-managed version of the platform. When using Amazon Web Services, Google Cloud Platform, or Microsoft Azure you can rely on the tools provided by those platforms. The cloud provider dedicated solutions may not be as powerful as the platforms that we discussed above, but they provide insight into the metrics, logs, and infrastructure data. They give us not only visibility into the metrics but also proactive monitoring like alerts and health checks that you can use to configure the basic monitoring. If you are using a cloud solution from Amazon, Microsoft, or Google and you would like to use monitoring provided by those companies have a look at what they offer. When using Amazon Web Services, Google Cloud Platform, or Microsoft Azure you can rely on the tools provided by those platforms. The cloud provider dedicated solutions may not be as powerful as the platforms that we discussed above, but they provide insight into the metrics, logs, and infrastructure data. They give us not only visibility into the metrics but also proactive monitoring like alerts and health checks that you can use to configure the basic monitoring. If you are using a cloud solution from Amazon, Microsoft, or Google and you would like to use monitoring provided by those companies have a look at what they offer. 12. Amazon CloudWatch

Source: http://docs.aws.amazon.com Amazon CloudWatch is primarily aimed at customers using Amazon Web Services, but can also read metrics from statsd and collectd providing a way to ship custom metrics to the platform. By default, it provides an out of the box monitoring for your AWS infrastructure, services, and applications. With the integrated logs support and synthetics monitoring, it allows the users to set up basic monitoring quickly to give insights into the whole environment that is living in the Amazon ecosystem. Features: View metrics and logs of your infrastructure, services, and applications. Insights into events coming from your AWS environment. Service map and tracing support via AWS X-Ray. Synthetic service for web application monitoring. Alerting with anomaly detection on metrics and logs. Pros: Available out of the box for Amazon Web Services Users. Support for custom metrics, so if you would like to stick to CloudWatch you can easily keep all your metrics there. Possibility to graph billing-related information and have that under control. Cons: Limited dashboarding and visualization capabilities. A limited number of dashboards that can be created in the free tier – if you have more than three dashboards will cost you $3.00 per month. Limited metrics granularity even when going for the paid service. Pricing Volume-based pricing – you pay for what you want to have visibility into and how detailed it is. Free tier enables monitoring of your AWS services with 5-minute metric granularity. The free tier is also effective for services like EBS volumes, RDS DB instances, and Elastic Load Balancers. It covers up to ten metrics and then alarms per month. In addition, the free tier includes up to 5GB logs per month, 3 dashboards, and 100 runs of synthetic monitors per month. The paid tier price is based on usage. For example, for metrics, the one-minute granularity metrics starts at $0.30 per metric per month for the first 10,000 metrics and go as low as $0.02 per metric per month when sending over one million metrics. With logs the situation is similar – the more you send the less you pay per gigabyte of data. 13. Azure Monitor

Source: http://docs.microsoft.com The Azure Monitor a solution primarily focused on monitoring the services located in the Microsoft Azure cloud services, but support custom metrics for resources outside of the cloud. It provides a full-featured observability solution giving you deep insights into your infrastructure, services, applications, and Azure resources with powerful dashboards, BI support, and alerting that will automatically notify you when needed. Features: Monitoring for your Microsoft Azure resources, services, first-party solutions, and custom metrics sent by your applications. Detailed infrastructure monitoring for deep insight into the metrics. Network activity, layout, and services layout visualization and monitoring. Support for alerts and autoscaling based on the metrics and logs. Powerful dashboarding capabilities with workbooks and BI support. Pros: Available out of the box for Microsoft Azure users. Azure resources, services, and first-party solutions expose their metrics in the free tier and other signals like logs and alerts have a free tier available. Support for workbooks and BI allows to connect business-level metrics with the signals coming from the services and infrastructure. Cons: It may be complicated and overwhelming for users that just started with Azure. Pricing The Azure Monitor pricing is based on the volume of the ingested data or reserved capacity. Selected metrics from the Azure resources, services, and first-party solutions are free. Custom metrics are paid once you pass the 150MB per month. Similar to other cloud vendors you pay less per unit of data the more data you send. The logs have the option to pay as you go which gives you up to 5GB of logs per billing account per month free and then $2.76 per GB of data. You can also go for reserved data – for example, 100GB of data per day will cost you $219.52 daily. Other monitoring elements are priced in a similar way with small or no free tier available. 14. Google Stackdriver

Source: http://cloud.google.com Formerly Stackdriver Google Cloud operations suite is primarily focused to give the users of Google Cloud platform the insights into the infrastructure and application performance, but it also supports custom metrics and other cloud providers like AWS. The platform provides metrics, logs, and traces support along with the visibility into Google Cloud platform audit logs giving you the full visibility of what is happening inside your GCP account. Features: Metrics and dashboards allowing visibility into the performance of your services with alerting. Health check monitoring for web applications and applications that can be accessed from the internet with uptime monitoring. Support for logs and logs routing with error reporting and alerting. Per-URL statistics based on distributed tracing for App Engine. Audit logs for visibility into security-related events in your Google Cloud account. Production debugging and profiling. Pros: Rich visualization support out of the box for Google Cloud platform users. Free tier available. Support for sending data to third-party providers if they provide an integration. Cons: Requires a manual cloud monitoring agent install, before getting visibility into the metrics, compared to AWS CloudWatch where this is not needed. Pricing Similar to Amazon CloudWatch and Microsoft Azure the pricing is based on the amount of data your services and applications are generating and sending to the platform. The free tier includes 150MB metrics per billing account, 50GB of logs per project, 1 million API calls per project, 2.5 million spans ingested per project and 25 million spans scanned per project. Everything above that falls into the paid tier. Most of the tools that we’ve discussed provide a form of alerting and reporting. Those are usually limited to a number of methods, like e-mail or text messages to your mobile, sometimes other common destinations. Usually, we don’t see scheduling, automation, and workflow control in the monitoring tools themselves. Because of that, the observability solutions provide integrations with third-party incident alerting and reporting tools filling the communication gap and providing additional features like event automation and triage, noise suppression, alerts, and notifications centralization and lots of destinations where the information can be sent to. Let’s see what tools can provide such functionalities. 15. PagerDuty

Source: Pagerduty.com The all in one alert and notification management and centralization solution. The PagerDuty provides the place where you can centralize notifications coming from various places, organize them, assign, automate, and send to virtually any destination you may think of. It not only provides a simple way of viewing and forwarding the data but also automates incident response, schedule on-call, and escalate incidents. Features: On-call management with flexible schedules, incident escalation, and alerting. Context filtering for alert reduction. Automated responses with status updates. Event automation with triage, alert grouping, and noise suppression. Dashboards for a variety of alert related information like operations, service health, responders, and incidents with customization capabilities. Pros: A large number of integrations available out of the box, which gives you the possibility to receive notifications on virtually any destination. Scheduling and notifications escalation. Services prioritization for controlling what is more important. Pricing The pricing is organized around the features and the number of users that will be using PagerDuty with no free tier available. The most basic plan starts from $10 for up to 6 users per month with an additional $15 per user after that and goes up to $47 per user per month depending on the features of the platform you want to use. 16. VictorOps

Source: Victorops.com VictorOps is the tool that will quickly become your central place for alerts and notifications. It makes it possible to take action on alerts, schedule who is on-call and should react to a given incident. With rules-based incident response, it is easy to automate responses for certain alerts to reduce the noise and fatigue generated by notifications coming from various systems hooked up with the rich set of available integrations. Features: On-call scheduling and management with incident escalation and hands-off. Alerts and notification centralization. Incident automation with alert rules, automatic response, and noise suppression. Reports and post-incident reviews. Pros: A large number of integrations available out of the box for centralizing the alerts and notifications in a single place. Dedicated tools for teams. Scheduling and incident escalation. Pricing The pricing is based one features and the number of users. The basic plan starts from $8 per user per month when paid monthly and goes up to $33 per user per month for the Enterprise plan. 17. OpsGenie

Source: Opsgenie.com From the creators of JIRA and Confluence comes OpsGenie, the central place for your alerts and notifications. It allows for management of alerts, planning on-call schedules, and reacting automatically based on user-defined rules. With a rich set of integrations, heartbeat monitoring, and alerts deduplication the platform can be used as a tool for centralizing all of your alerts and notifications. Features: Pros: Rich set of integrations available out of the box for centralizing the notifications and alerts in a single place. Team centric tools for multiple teams integrations. Heartbeat monitoring and alerts deduplication. Free tier available. Pricing The pricing is based on features and the number of users. It starts with the limited free tier for up to 5 users with basic alerting and on-call management aimed for small teams. The first non-free tier starts with $11 per user per month when billed monthly and goes up to $35 per user per month with monthly billing. The price depends on the set of features of the platform that you will use. For instance, if you are OK with up to 25 international SMS notifications per user per month you will be fine with the basic, non-free plan. 18. xMatters

Source: http://xmatters.com xMatters is a user-friendly central place for all your alerts and notifications. It allows managing and reacting on incidents from a single place with on-call schedules, incident escalation, and rule-based responses and resolutions. With the incident timeline, you can see how the reaction on the incident was performed and how well the team reacted to the situation giving your organization a tool helping you in improving alerts handling. Features: Pros: Over 100 integrations are available at the time of writing. Easy to learn and user-friendly. Free tier available. Pricing The pricing, similar to the rest of the competitors like OpsGenie and PagerDuty is organized around features and the number of users. The pricing plans start with a free tier that is available for up to 10 users without any kind of SMS and voice notifications. The first paid plan starts at $16 per user per month and goes up to $59 per user per month making it the most expensive of the tools. Of course, the price depends on the features of the platform you choose to use. For example, if you are OK with up to 50 SMS notifications per user per month you will be fine with the basic, non-free plan.
What Tools Will You Use?
Cloud computing, the public, hybrid, and private cloud environments opened up a world of opportunities. Flexibility, on-demand scaling, ready to use services, and the ease of use that comes with that allow for the next generation of platforms to be built on top of them. However, to leverage all the opportunities you need to deal with a set of challenges. Those require good tools so you can understand the state of the environment along with all the key performance indicators that your environment provides. The available cloud monitoring tools all help you with the gathering of observability data, but they take different approaches, provide different functionalities, and come with different costs. With the wide range of solutions available make sure to try different solutions and choose the one that fits your needs the most. This article has been published from a wire agency feed without modifications to the text. Only the headline has been changed. #CloudMonitoringTools#CloudMonitoring#2020#news#blockgeni Source link Read the full article
0 notes
Text
Why IBM QRADAR SIEM Training?
Why IBM QRADAR SIEM Training
For several years running, QRadar has been the leader in Gartner’s Magic Quadrant for SIEM.
What is IBM QRADAR SIEM
IBM QRadar is an enterprise (SIEM)product
IBM Security QRadar Training SIEM is a tech platform developed by IBM to provide a 360-degree overview of an organization’s security system.
QRadar normalizes events that come from a security system’s log sources and correlates them according to certain rules configured in QRadar.
IBM QRadar online training collects log data from an enterprise, network devices, host assets, operating systems, applications, vulnerabilities, user activities and behaviors.
IBM QRadar performs real-time analysis of the log data and network flows for identify malicious activity so it could be stopped quickly, preventing or minimizing damage to an organization.
Why QRadar Online Training Is Best SIEM Tool
IBM Security QRadar SIEM will correlate system vulnerabilities with an incident and network information, it helps to rank security incidents.
Provides close to time period visibility for threat detection and prioritization, delivering surveillance throughout for the whole��IT infrastructure.
Reduces and prioritizes alerts to focus investigations on an unjust list of suspected incidents.
Enables more practical threat management whereas manufacturing careful information access and user activity reports.
Delivers security intelligence in cloud environments.
Produces detailed information access and user activity reports to assist manage compliance.
Features Of IBM QRadar SIEM
l API Updates
l Historical Correlation
l Overlapping IP Support in SIEM
l Support LDAP Authorization
l Deployment Actions from System Management
l Enterprise Ready Reporting
l Patch Rollback Framework
l Factory Re-install, new ‘retain’ option to preserve /store
l Offense (CRE) Count Resets
l Password Storage Enhancement in QRadar
l Complex threat detection
l Malicious activity identification
l User activity monitoring
l Compliance monitoring
l data loss prevention & Fraud detection for more key use cases
IBM Security QRadar SIEM training providing larger eases of use Sense Analytics Engine to & lower total value of possession whereas uses a sophisticated discover & advanced threats.IBM QRadar SIEM classroom training7.2 (Security Intelligence Platform provides an event management), incident response, log management, incident forensics, anomaly detection, & unified design for desegregation security info & vulnerability management & configuration.
Prerequisites for IBM QRadar SIEM online training
IT infrastructure
IT security fundamentals
Linux
Windows
TCP/IP networking
Syslog
Futures with IBM QRADAR online training
$1.2B more investing in cloud biggest IT solution provider.
$6B R&D investment-huge intellectual property rights.
Strong customer experience.
Hybrid approach.
Open source platform.
Highly scalable & available architecture.
IBM QRADAR is the winner in the SANS Best of Award program for Security Information and Event Management (SIEM).
For more details, IBM QRadar Training kindly feels free to contact us.
Name – Avishek Priyadarshi
Email: [email protected]
Phone: +91-8553177744
http://www.maxmunus.com/page/IBM-QRadar-SIEM-Training
#ibm qradar#IBM QRadar free training#IBM QRadar Online Training#IBM QRadar SIEM training#Siem IBM QRadar Itrtg IbmSecurity Online Training Security Information Technology
0 notes
Text
IBM QRadar security training @MaxMunus
This IBM QRadar training is designed for security analysts, security technical architects, offense managers, network administrators, and system administrators using QRadar SIEM.
IBM Security QRadar SIEM is a tech platform developed by IBM to provide a 360-degree overview of an organization’s security system.
QRadar normalizes events that come from a security system’s log sources and correlates them according to certain rules configured in QRadar.
IBM QRadar collects log data from an enterprise, network devices, host assets, operating systems, applications, vulnerabilities, user activities and behaviors.
IBM QRadar performs real-time analysis of the log data and network flows for identify malicious activity so it could be stopped quickly, preventing or minimizing damage to an organization.
IBM SECURITY QRADAR SIEM For several years running, QRadar has been the leader in Gartner’s Magic Quadrant for SIEM.
What is IBM QRADAR SIEM
IBM QRadar is an enterprise(SIEM)product. IBM Security QRadar SIEM is a tech platform developed by IBM to provide a 360-degree overview of an organization’s security system.QRadar normalizes events that come from a security system’s log sources and correlates them according to certain rules configured in QRadar.
IBM QRadar collects log data from an enterprise, network devices, host assets, operating systems, applications, vulnerabilities, user activities and behaviors.IBM QRadar performs real-time analysis of the log data and network flows for identify malicious activity so it could be stopped quickly, preventing or minimizing damage to an organization.
Why QRadar Is Best SIEM Tool
IBM Security QRadar SIEM will correlate system vulnerabilities with an incident and network information, it helps to rank security incidents.
Provides close to time period visibility for threat detection and prioritization, delivering surveillance throughout for the whole IT infrastructure.
Reduces and prioritizes alerts to focus investigations on an unjust list of suspected incidents.
Enables more practical threat management whereas manufacturing careful information access and user activity reports.
Delivers security intelligence in cloud environments.
Produces detailed information access and user activity reports to assist manage compliance.
Features Of IBM QRadar SIEM
l API Updates
l Historical Correlation
l Overlapping IP Support in SIEM
l Support LDAP Authorization
l Deployment Actions from System Management
l Enterprise Ready Reporting
l Patch Rollback Framework
l Factory Re-install, new ‘retain’ option to preserve /store
l Offense (CRE) Count Resets
l Password Storage Enhancement in QRadar
l Complex threat detection
l Malicious activity identification
l User activity monitoring
l Compliance monitoring
l data loss prevention & Fraud detection for more key use cases
IBM Security QRadar SIEM providing larger eases of use Sense Analytics Engine to & lower total value of possession whereas uses a sophisticated discover & advanced threats.IBM QRadar SIEM 7.2 (Security Intelligence Platform provides an event management), incident response, log management, incident forensics, anomaly detection, & unified design for desegregation security info & vulnerability management & configuration.
Prerequisites
IT infrastructure
IT security fundamentals
Linux
Windows
TCP/IP networking
Syslog
Futures Of IBM QRADAR
$1.2B more investing in cloud biggest IT solution provider.
$6B R&D investment-huge intellectual property rights.
Strong customer experience.
Hybrid approach.
Open source platform.
Highly scalable & available architecture.
IBM QRADAR is the winner in the SANS Best of Award program for Security Information and Event Management (SIEM).
· For more details kindly feel free contact with us.
· Name — saurabh
· Email: [email protected]
· Phone: +91–8553576305 (WhatsApp)
· Skype Id: saurabhmaxmunus
http://www.maxmunus.com/page/IBM-Qradar-SIEM-Training
0 notes
Text
Docker and osquery
If you are into security you might have heard about osquery. It is extremely powerful tool that can be used for various purposes:
Real time endpoint monitoring
Anomaly detection
File integrity monitoring
Metrics (prometheus)
Container (docker) monitoring
syslog aggregation
…
Numerous enterprises big and small from all verticals are using it, or planning on using it. It is being deployed to…
View On WordPress
0 notes
Text
Security Analytics – Visualization – Big Data Workshop Black Hat 2017
VISUAL ANALYTICS – DELIVERING ACTIONABLE SECURITY INTELLIGENCE
BlackHat 2017 - Las Vegas
Big Data is Getting Bigger - Visualization is Getting Easier - Learn How! Dates: July 22-23 & 24-25 Location: Las Vegas, USA SIGN UP NOW
OVERVIEW
Big data and security intelligence are the two very hot topics in security. We are collecting more and more information from both the infrastructure, but increasingly also directly from our applications. This vast amount of data gets increasingly hard to understand. Terms like map reduce, hadoop, spark, elasticsearch, data science, etc. are part of many discussions. But what are those technologies and techniques? And what do they have to do with security analytics/intelligence? We will see that none of these technologies are sufficient in our quest to defend our networks and information. Data visualization is the only approach that scales to the ever changing threat landscape and infrastructure configurations. Using big data visualization techniques, you uncover hidden patterns of data, identify emerging vulnerabilities and attacks, and respond decisively with countermeasures that are far more likely to succeed than conventional methods. Something that is increasingly referred to as hunting. The attendees will learn about log analysis, big data, information visualization, data sources for IT security, and learn how to generate visual representations of IT data. The training is filled with hands-on exercises utilizing the DAVIX live CD.
What's New?
The workshop is being heavily updated over the next months. Check back here to see a list of new topics:
Security Analytics - UEBA, Scoring, Anomaly Detection
Hunting
Data Science
10 Challenges with SIEM and Big Data for Security
Big Data - How do you navigate the ever growing landscape of Hadoop and big data technologies? Tajo, Apache Arrow, Apache Drill, Druid, PrestoDB from Facebook, Kudu, etc. We'll sort you out.
SYLLABUS
The syllabus is not 100% fixed yet. Stay tuned for some updates.
Day 1:
Log Analysis
Data Sources Discussion - including PCAP, Firewall, IDS, Threat Intelligence (TI) Feeds, CloudTrail, CloudWatch, etc.
Data Analysis and Visualization Linux (DAVIX)
Log Data Processing (CSVKit, ...)
SIEM, and Big Data
Log Management and SIEM Overview
LogStash (Elastic Stack) and Moloch
Big Data - Hadoop, Spark, ElasticSearch, Hive, Impala
Data Science
Introduction to Data Science
Introduction to Data Science with R
Hunting
Day 2:
Visualization
Information Visualization History
Visualization Theory
Data Visualization Tools and Libraries (e.g., Mondrian, Gephi, AfterGlow, Graphiti)
Visualization Resources
Security Visualization Use-Cases
Perimeter Threat
Network Flow Analysis
Firewall Visualization
IDS/IPS Signature Analysis
Vulnerability Scans
Proxy Data
User Activity
Host-based Data Analysis
Sample of Tools and Techniques
Tools to gather data:
argus, nfdump, nfsen, and silk to process traffic flows
snort, bro, suricata as intrusion detection systems
p0f, npad for passive network analysis
iptables, pf, pix as examples of firewalls
OSSEC, collectd, graphite for host data
We are also using a number of visualization tools to analyze example data in the labs:
graphviz, tulip, cytoscape, and gephi
afterglow
treemap
mondrian, ggobi
Under the log management section, we are going to discuss:
rsyslog, syslog-ng, nxlog
logstash as part of the elastic stack, moloch
commercial log management and SIEM solutions
The section on big data is covering the following:
hadoop (HDFS, map-reduce, HBase, Hive, Impala, Zookeper)
search engines like: elastic search, Solr
key-value stores like MongoDB, Cassandra, etc.
OLAP and OLTP
The Spark ecosystem
SIGN UP
TRAINER
Raffael Marty is vice president of security analytics at Sophos, and is responsible for all strategic efforts around security analytics for the company and its products. He is based in San Francisco, Calif. Marty is one of the world's most recognized authorities on security data analytics, big data and visualization. His team at Sophos spans these domains to help build products that provide Internet security solutions to Sophos' vast global customer base.
Previously, Marty launched pixlcloud, a visual analytics platform, and Loggly, a cloud-based log management solution. With a track record at companies including IBM Research, ArcSight, and Splunk, he is thoroughly familiar with established practices and emerging trends in the big data and security analytics space. Marty is the author of Applied Security Visualization and a frequent speaker at academic and industry events. Zen meditation has become an important part of Raffy's life, sometimes leading to insights not in data but in life.
from Security Analytics – Visualization – Big Data Workshop Black Hat 2017
0 notes
Text
Why IBM QRADAR SIEM Training By MaxMunus?
Why IBM QRADAR SIEM Training?
For several years running, QRadar has been the leader in Gartner’s Magic Quadrant for SIEM.
What is IBM QRADAR SIEM?
IBM QRadar is an enterprise (SIEM)product
IBM Security QRadar Training SIEM is a tech platform developed by IBM to provide a 360-degree overview of an organization’s security system.
QRadar normalizes events that come from a security system’s log sources and correlates them according to certain rules configured in QRadar.
IBM QRadar online training collects log data from an enterprise, network devices, host assets, operating systems, applications, vulnerabilities, user activities and behaviors.
IBM QRadar performs real-time analysis of the log data and network flows for identify malicious activity so it could be stopped quickly, preventing or minimizing damage to an organization.
Why MaxMunus’s QRadar Online Training Is Best SIEM Tool
IBM Security QRadar SIEM will correlate system vulnerabilities with an incident and network information, it helps to rank security incidents.
Provides close to time period visibility for threat detection and prioritization, delivering surveillance throughout for the whole IT infrastructure.
Reduces and prioritizes alerts to focus investigations on an unjust list of suspected incidents.
Enables more practical threat management whereas manufacturing careful information access and user activity reports.
Delivers security intelligence in cloud environments.
Produces detailed information access and user activity reports to assist manage compliance.
Features Of IBM QRadar SIEM
l API Updates
l Historical Correlation
l Overlapping IP Support in SIEM
l Support LDAP Authorization
l Deployment Actions from System Management
l Enterprise Ready Reporting
l Patch Rollback Framework
l Factory Re-install, new ‘retain’ option to preserve /store
l Offense (CRE) Count Resets
l Password Storage Enhancement in QRadar
l Complex threat detection
l Malicious activity identification
l User activity monitoring
l Compliance monitoring
l data loss prevention & Fraud detection for more key use cases
IBM Security QRadar SIEM training providing larger eases of use Sense Analytics Engine to & lower total value of possession whereas uses a sophisticated discover & advanced threats.IBM QRadar SIEM classroom training7.2 (Security Intelligence Platform provides an event management), incident response, log management, incident forensics, anomaly detection, & unified design for desegregation security info & vulnerability management & configuration.
Prerequisites for IBM QRadar SIEM online training
IT infrastructure
IT security fundamentals
Linux
Windows
TCP/IP networking
Syslog
Futures with IBM QRADAR online training
$1.2B more investing in cloud biggest IT solution provider.
$6B R&D investment-huge intellectual property rights.
Strong customer experience.
Hybrid approach.
Open source platform.
Highly scalable & available architecture.
IBM QRADAR is the winner in the SANS Best of Award program for Security Information and Event Management (SIEM).
· For more details IBM QRadar Training kindly feel free contact with us.
· Name – Avishek Priyadarshi
· Email: [email protected]
· Phone: +91-8553177744.
http://www.maxmunus.com/page/IBM-QRadar-SIEM-Training
#IBM QRadar SIEM training#IBM QRadar online training#IBM QRadar corporate training#IBM QRadar SIEM Tools#IBM QRadar Tutotrials
0 notes
Text
IBM Qradar SIEM Real time training by MaxMunus
Prerequisites
v IT infrastructure
v IT security fundamentals
v Linux
v Windows
v TCP/IP networking
v Syslog
IBM QRADAR SIEM: IBM QRadar is an enterprise (SIEM) product.
IBM Security QRadar SIEM is a tech platform developed by IBM to provide a 360-degree overview of an organization’s security system.QRadar normalizes events that come from a security system’s log sources and correlates them according to certain rules configured in QRadar.IBM QRadar collects log data from an enterprise, network devices, host assets, operating systems, applications, vulnerabilities, user activities and behaviors.
IBM QRadar performs real-time analysis of the log data and network flows for identify malicious activity so it could be stopped quickly, preventing or minimizing damage to an organization.
Why QRadar is Best SIEM Tool?
IBM Security QRadar SIEM will correlate system vulnerabilities with an incident and network information, it helps to rank security incidents.
ü Provides close to time period visibility for threat detection and prioritization, delivering surveillance throughout for the whole IT infrastructure.
ü Reduces and prioritizes alerts to focus investigations on an unjust list of suspected incidents.
ü Enables more practical threat management whereas manufacturing careful information access and user activity reports.
ü Delivers security intelligence in cloud environments.
ü Produces detailed information access and user activity reports to assist manage compliance.
Features Of IBM QRadar SIEM
v API Updates
v Historical Correlation
v lOverlapping IP Support in SIEM
v Support LDAP Authorization
v Deployment Actions from System Management
v Password Storage Enhancement in QRadar
v Complex threat detection
v Malicious activity identification
v User activity monitoring
v Compliance monitoring
v data loss prevention & Fraud detection for more key use cases
IBM Security QRadar SIEM providing larger eases of use Sense Analytics Engine to & lower total value of possession whereas uses a sophisticated discover & advanced threats.IBM QRadar SIEM 7.2 (Security Intelligence Platform provides an event management), incident response, log management, incident forensics, anomaly detection, & unified design for desegregation security info & vulnerability management & configuration.
Futures Of IBM QRADAR
Ø $1.2B more investing in cloud biggest IT solution provider.
Ø $6B R&D investment-huge intellectual property rights.
Ø Strong customer experience.
Ø Hybrid approach.
Ø Open source platform.
Ø Highly scalable & available architecture.
Ø IBM QRADAR is the winner in the SANS Best of Award program for Security Information and Event Management (SIEM).
Ø For several years running, QRadar has been the leader in Gartner’s Magic Quadrant for SIEM.
MaxMunus is providing best Online As well corporate Training.We are also providing software for practice.
For Joining IBM QRadar SIEM Online Training or Demo please feel free to call or email us.
Name ::saurabh
Skype id-saurabhmaxmunus
Contact No.-+91-8553576305 (whatsapp)
Company Website – http://www.maxmunus.com/page/IBM-Qradar-SIEM-Training
0 notes